Open X analytics on any post right now and you will see an impression number sitting at the top — usually far larger than any other figure on the page. Most creators stare at it, feel something vague (pride if it is high, anxiety if it is low), and move on without really understanding what caused it to be that number.
That is a problem — because once you genuinely understand how X counts impressions, every other metric on the platform begins to make more sense. Engagement rate, reach, follower growth — they all connect back to impressions as their root input.
“An impression is not a measure of attention — it is a measure of exposure. It tells you your content reached the screen. What happens next is the real story.”
— X Promotion PR Agency, Platform Analytics Team
Feed Exposure what it isContent Rendering the triggerVisibility Tracking how X logs itPlatform Metrics where to find itOrganic Reach no paid spendPromoted Reach paid delivery
What Exactly Triggers an Impression on X
The trigger is simpler than most people expect: a post rendering on a user’s screen. That is it. No click. No tap. No scroll-stop. No time threshold. The moment X’s app or website paints a post onto any user’s display, one impression is logged for that post’s author.
Think of it like a newspaper on a doorstep. The moment the paper lands and the headline is technically visible — even if the homeowner walks straight past without reading it — the newspaper has registered an exposure. X’s visibility tracking works on exactly the same principle, applied to digital content rendering across millions of devices simultaneously.
✅ What counts as an impression on X
Post appears in your For You feed as you scroll — even briefly
Post appears in someone’s Following feed at the top
Post renders in an X search result page
Post appears on another user’s profile when visited
Post surfaces in an X List that someone is browsing
Post renders via a repost in someone else’s feed
Post appears in the Explore tab or trending topics section
Post loads via an embedded X widget on an external website
⚠️
Common misconception: Many creators assume impressions only count when someone engages. They do not. A post can receive 50,000 impressions with zero likes or replies. Impressions measure rendering — engagement measures response. They are completely independent metrics that happen to live in the same analytics dashboard.
Inside the Phone: How Feed Rendering Actually Works
To understand impressions properly, it helps to visualise what actually happens inside the app from the moment a user opens X to the moment your post appears on their screen. The sequence below breaks that process down.
𝕏For You · Following🔔
E
Elon Musk
@elonmusk · 2h
Big things coming to X this quarter. Stay tuned.
💬 428🔁 1.2K♥ 8.4K✦
42,100impressions logged
M
Marketing Lead
@mktlead · 4h
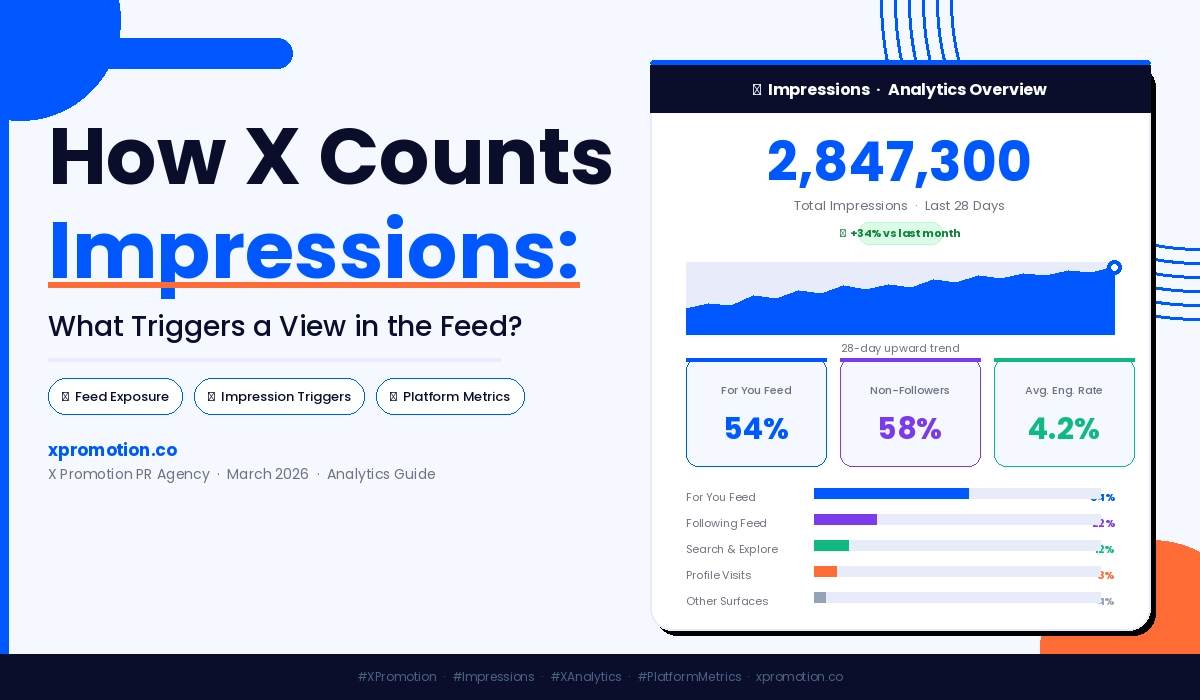
New X analytics study shows 58% of impressions come from non-followers via the For You feed.
💬 14🔁 89♥ 312✦
6,840impressions logged
① Feed request sent
User opens X. The app requests a personalised ranked list of posts from X’s servers, assembled by the recommendation engine based on the user’s interest graph and follow network.
② Posts ranked and returned
Each candidate post is scored on predicted engagement, recency, topical relevance, and author authority. The highest-scoring posts are sent to the device and queued for rendering.
③ Post enters viewport — impression fires
As the user scrolls, each post enters the visible screen area. The exact moment a post is rendered (painted to screen), an impression event fires and is sent to X’s analytics pipeline.
④ Logged in analytics (within minutes)
The event is processed and appears in the post author’s X Analytics dashboard, usually within a few minutes. During high-traffic periods, a 24–48 hour reporting lag is possible.
Post, Profile, and Account Impressions — Three Different Things
X uses the word “impression” in three distinct contexts inside its analytics tools, and mixing them up leads to very confused strategy decisions. Here is the clearest breakdown of all three.
Type 01▼
📄 Post Impressions — Content-Level Visibility
Post impressions count how many times a specific post was rendered across any surface on X — For You feed, Following feed, search results, profile visits, reposts, lists, or external embeds. Found inside individual post analytics when you tap the chart icon on any post. This is the primary measure of how far a specific piece of content has travelled on the platform. It answers: how many screens did this post reach?
Type 02▼
👤 Profile Impressions — Account Discovery
Profile impressions count how many times your profile page itself — not your posts, but your actual @handle page — was visited and rendered. These typically spike when a post performs well and curious users click through to learn more about you. Found in X Analytics under the “Profile Visits” metric. Answers: how many people came directly to my account page? High profile impressions relative to your follower count signal strong discovery momentum.
Type 03▼
📊 Account-Level Impressions — The Aggregate Total
Your account-level impression total is simply the arithmetic sum of every individual post impression count within your selected reporting window. If you published 8 posts last week and they received 5K, 3K, 12K, 2K, 8K, 4K, 6K, and 1K impressions respectively, your account total is 41,000. Found in the X Analytics summary tab. Most useful for tracking directional trends — is your overall reach growing, plateauing, or declining month over month?
Impression Type
Typical Trend Pattern
Where to Find It
Best Used For
Post Impressions
Individual post · tap chart icon
Content performance diagnosis
Profile Impressions
X Analytics · Overview tab
Account discovery tracking
Account Impressions
X Analytics · Summary tab
Strategy-level trend analysis
Organic vs Promoted Impressions — A Complete Comparison
X reports organic and promoted impressions separately, and understanding the difference determines how you read your data and how you invest your time and budget. The comparison below covers every dimension that matters.
🌱 Organic Impressions
📢 Promoted Impressions
Source
EARNED Generated by X’s recommendation engine based on relevance scoring and engagement signals
PAID Purchased via X Ads and delivered to advertiser-defined target audiences
Trigger
Post renders on screen in any organic feed surface
Post renders on screen after being placed by the ad delivery system
Cost
FREE No spend required — earned through content quality and consistency
PAID Billed per impression (CPM) or per engagement (CPE) depending on campaign objective
Algo Signal
Contributes to the post’s relevance score — high organic engagement boosts further distribution
Does not feed back into organic algorithm — paid impressions are invisible to the recommendation engine
Where Reported
X Analytics — Organic column
X Ads Manager + X Analytics — Promoted column
Longevity
Can compound over days or weeks if content spreads via reposts
Stops the moment the campaign budget is exhausted or paused
Why Impressions Drop — and How to Read Each Signal
Impression drops feel sudden but are almost never random. They each correspond to a measurable variable that changed in your account’s behaviour, content quality, or posting patterns. Below is a signal-by-signal breakdown of the most common causes.
📉 Engagement Rate DeclineMost Common
X’s recommendation engine uses engagement rate as a quality signal. When replies, reposts, and bookmarks fall relative to impressions, the algorithm distributes your next posts to fewer feeds. Fix: audit your last 20 posts and identify which format, topic, and hook style produced the highest engagement rate — then do more of that.
🔇 Posting Frequency GapVery Common
Accounts that go quiet lose algorithmic momentum. X’s system treats posting consistency as a reliability signal. A gap of 3+ days without posting is enough to require re-earning distribution momentum from scratch. Fix: even one post per day maintains baseline distribution.
🕐 Audience Timing ShiftModerate
If your core audience shifts when they are active on X — seasonally, or due to a life event like a school term starting — posts published at historically effective times may now land during lower-traffic windows. Fix: check your X Analytics audience activity heatmap and adjust publishing times accordingly.
📈 Post-Viral RecalibrationSituational
After one unusually high-performing post, the algorithm temporarily raises its distribution threshold for your account. Your next average post appears to “drop” when measured against the spike baseline — but it is actually performing normally. Fix: don’t over-index on one viral post. Compare 30-day averages, not peak-to-current.
⏳ Analytics Reporting LagLess Common
During periods of high platform traffic, X’s analytics pipeline can run 24–48 hours behind real time. A drop visible today may partially resolve tomorrow once the data catches up. Fix: wait 48 hours before drawing conclusions from what looks like a sudden drop.
🔀 Content Format MismatchCommon
Switching content formats suddenly — from threads to single posts, from text-only to video, or from opinion posts to promotional content — disrupts the algorithm’s learned model of your account. Fix: transition formats gradually, blending new and familiar formats rather than switching all at once.
The Impression Signals That Actually Determine Your Reach
Understanding what causes impressions is only half the picture. The other half is knowing which signals X’s system monitors to decide how many impressions your next post should receive before it even goes live. These are the inputs that matter most.
“Every post you publish carries a predicted engagement score before a single human sees it — based entirely on your recent account history. Your past posts literally determine how many people your next post reaches.”
— Platform analytics principle, based on X’s publicly documented recommendation approach
💬 Reply RateHigh Impact
Replies are the strongest engagement signal on X. A post that sparks conversation tells the algorithm this content is generating real human interest. Even brief replies count. Posts asking a direct question consistently outperform statements on this signal.
🔖 Bookmark RateHigh Impact
Bookmarks are a private signal invisible to other users — but highly visible to the algorithm. When someone bookmarks a post, it signals “this content is worth saving,” which X treats as a strong quality indicator. Useful, educational, or reference-style content performs best here.
🔁 Repost + Quote RateHigh Impact
Reposts distribute your content into the feeds of an entirely new audience — generating a second wave of impressions from people who were not initially in your distribution pool. Quote posts add even more reach by wrapping your content in someone else’s commentary.
🕐 Post TimingMedium Impact
The first 30 minutes after publishing are critical. If a post receives strong early engagement in that window, the algorithm treats it as a signal of broad appeal and distributes it more aggressively. Publishing when your audience is most active maximises that early engagement window.
❤️ Like RateMedium Impact
Likes contribute to distribution scoring but carry less weight than replies and bookmarks. They are the lowest-friction engagement action, which is why the algorithm weights them proportionally lower — they are less indicative of genuine deep interest than a reply or save.
🔗 Link Click RateLower Impact
Posts containing links to external websites are distributed more conservatively by X’s algorithm, as they take users off the platform. Link click rate matters, but the presence of a link itself can reduce initial distribution. Keep promotional content separate from high-reach organic content where possible.
X Growth & PR Services — X Promotion PR Agency
From content strategy and PR to compliant growth services — everything your X presence needs in one agency.
X Promotion PR Agency builds impression strategies that grow your visibility through compliant, sustainable methods — no shortcuts, no guesswork, no algorithm violations.
Impressions on X are not a number to chase — they are a number to read. When impressions are high and engagement rate is low, your distribution is working but your content is not connecting. When impressions are low and engagement rate is high, your content is excellent but your reach is being constrained by one of the signals covered in this guide. Each combination points to a completely different lever to pull, and that diagnostic clarity is the real value of understanding the metric properly. The accounts that treat impressions as data — rather than as a score to be proud of — are consistently the ones that build compounding, sustainable visibility on X over time.
Frequently Asked Questions
The most searched questions about X impressions from Reddit, Quora, and Google — answered without speculation.
Yes. X records an impression the instant a post is rendered on a user’s screen. No tap, like, or dwell time is required. Simply scrolling past so that the post briefly appears in the visible viewport is enough to log one impression event for that post. This is why impression counts are almost always significantly higher than any engagement metric on the same post — most people see content without interacting with it.
Post impressions count how many times a specific post was displayed across any surface on X — feeds, search results, profile pages, or embedded widgets. Profile impressions count how many times your own profile page was visited and rendered. They measure two fundamentally different things — content exposure versus account discovery — and are reported separately inside X Analytics. A viral post typically causes both to spike simultaneously, but they can also move independently of each other.
Sudden drops are almost always caused by one of six things: a falling per-post engagement rate, reduced posting frequency, an audience timing shift, post-viral recalibration, a content format change, or an analytics pipeline reporting lag. Check your engagement rate first — if it has fallen alongside impressions, that is the root cause in the majority of cases. If engagement rate is stable and impressions dropped, look at your posting frequency and timing next. A 24–48 hour reporting lag during high-traffic periods can also make drops appear more dramatic than they actually are.
The trigger is identical — a post rendering on a screen counts as one impression regardless of how it was delivered. However, organic impressions are earned through X’s recommendation engine based on engagement and relevance signals, whilst promoted impressions are purchased via X Ads and delivered to advertiser-defined target audiences. Both are counted at the point of rendering but reported in separate columns in X Analytics and Ads Manager. One important distinction: promoted impressions do not feed back into the organic algorithm — paying for impressions does not tell the recommendation engine your content is high quality.
X calculates account-level impressions by summing the individual impression counts from every post published within your selected reporting window. It is a straightforward cumulative total — not a unique viewer count. If you published 10 posts and each received an average of 2,000 impressions, your account total for that period is 20,000. This aggregate figure appears in the X Analytics summary tab and is most useful for identifying directional trends across weeks or months, rather than evaluating individual post performance.