
In the fast-paced world of X, where every post competes for attention, metrics like impressions, views, and reach serve as your growth compass. These performance metrics reveal how your content achieves audience exposure, but they differ in nuance impressions track total visibility opportunities, views confirm actual watches, and reach measures unique eyes. Mastering them helps optimize frequency, boost engagement rates, and calculate click-through rates (CTR) effectively. This article compares them head-to-head, with examples and scenarios, to demystify why high numbers don’t always translate to real impact.
Defining the Core Metrics: Impressions, Views, and Reach
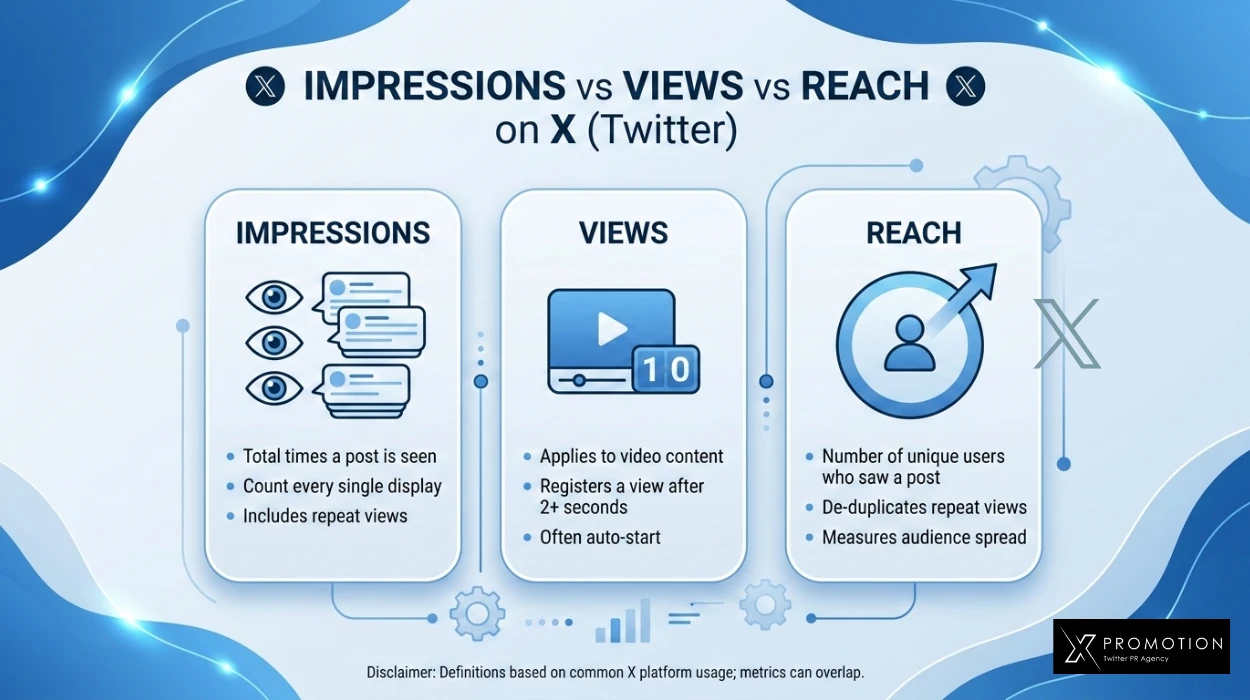
Start with the basics to grasp their roles in driving growth. Impressions count every time your post appears on a user’s screen, even if they scroll past without noticing—like a billboard flashing by on a highway. On X, this includes timelines, search results, profiles, and replies, capturing raw audience exposure regardless of interaction.
Views, a video-specific metric, step it up by requiring at least 2 seconds of playback (or full play for shorter clips). Unlike impressions, views demand active consumption, signaling deeper exposure. For instance, a promotional reel racking up 10,000 impressions might yield only 3,000 views if users skip most plays.
Reach, meanwhile, tallies unique accounts exposed to your content, ignoring frequency. If one user sees your post five times, reach counts them once. This metric shines for gauging audience size, while impressions reveal how often that audience encounters you.
Real-world scenario: A London-based brand posts a local festival teaser. It garners 50,000 impressions (frequent timeline pops), 15,000 views (engaged video watches), and 20,000 reach (unique locals noticing it). These baselines set the stage for growth comparisons.
Impressions vs Views: Exposure Potential Meets Actual Consumption
Impressions and views diverge sharply in measuring content performance. Impressions emphasize potential—your post’s footprint across X’s algorithm-driven feeds—while views demand proof of interest through video engagement. High impressions with low views often flag skippable content, like static images buried in noisy threads.
Consider a thread on London’s street food scene: 100,000 impressions from algorithmic boosts mean broad exposure, but if only 20% convert to views, users aren’t sticking around. Why? Poor thumbnails or irrelevant hooks reduce playback initiation. In contrast, a polished video recipe might flip this, achieving 80,000 views from 90,000 impressions by hooking viewers instantly.
This gap matters for growth strategies. Impressions scale with posting frequency and hashtags, inflating numbers without quality. Views, tied to X’s playback rules, reflect retention a key performance metric for video-heavy accounts. Track the view-to-impression ratio (e.g., 30-50% ideal) to refine thumbnails and captions, turning passive scrolls into active watches.
Example: Tech influencer @GadgetGuruX posts a smartphone unboxing. Impressions hit 250,000 via retweets, but views lag at 75,000 due to a bland intro. Tweaking with a 1-second hook lifts views to 180,000 next time, boosting overall growth by prioritizing consumption over sheer volume.
Reach vs Impressions: Unique Audience vs Repeated Exposure
Reach and impressions compare like a guest list versus door scans at a party. Reach focuses on unique users (e.g., 10,000 distinct accounts), while impressions capture every sighting, including multiples from the same user—highlighting frequency’s role in audience exposure.
High impressions with modest reach signal repeated delivery to loyal followers, useful for brand recall but risky for stagnation. If impressions are 200,000 but reach is 25,000, your content bombards 25,000 users eight times each—great for top-of-mind awareness, less so for expansion.
Scenario: A PR agency in UK promotes a client event. Impressions reach 150,000, but reach caps at 30,000 due to echo-chamber retweets among locals. To widen reach, they add trending UK hashtags, pushing unique exposure to 80,000 while impressions climb to 300,000. This balance grows followers by tapping new demographics.
Performance tip: Divide impressions by reach for average frequency (e.g., 5x means solid reinforcement). Aim for 2-4x to avoid fatigue, where overexposure drops engagement rates. Reach drives scalable growth; impressions amplify it.
How Engagement Relates to Impressions: From Visibility to Interaction
Engagement likes, replies, reposts, quotes—builds directly on impressions, turning raw exposure into relational growth. Not every impression sparks action, but higher impressions create more opportunities, correlating with elevated engagement rates (engagements divided by impressions).
Picture impressions as seeds: A post with 1 million impressions might yield 5% engagement rate (50,000 interactions), fueling algorithmic pushes. Low-engagement impressions (under 1%) waste potential, as X prioritizes interactive content in feeds.
Real-world tie-in: During any country’s cricket fever, a fan account’s match prediction post gets 500,000 impressions. Engagement surges to 25,000 (5% rate) via replies debating scores, extending reach organically. Conversely, a generic ad with 500,000 impressions flops at 0.5% engagement due to salesy tone, limiting growth.
Frequency plays here—repeated impressions to engaged users compound interactions. Monitor this via X Analytics: If impressions rise but engagement flatlines, audit content relevance to reclaim momentum.
Impressions and Click-Through Rate (CTR): The Path to Conversions
CTR (clicks divided by impressions x 100) links impressions to action, measuring how effectively exposure drives traffic. Strong impressions without CTR reveal mismatched audience or weak calls-to-action (CTAs), stunting growth beyond views.
Example: An e-commerce post for London handicrafts logs 100,000 impressions and 2,000 link clicks (2% CTR)—solid for X’s 1-3% benchmarks. But if impressions double to 200,000 without CTR gains, the extra exposure underperforms, possibly from ad fatigue.
Scenario: X Promotion PR Agency tests bios. Original: 80,000 impressions, 1% CTR (800 clicks). Revised with urgent CTA (“Shop now—limited stock!”): Same impressions, 3.5% CTR (2,800 clicks). This highlights impressions as CTR’s foundation—scale them strategically via optimal posting times.
Pro insight: Benchmark CTR against industry (e.g., 1.5% for B2C). Pair with video views for layered analysis; high-view impressions often lift CTR by building trust first.
Why High Impressions Don’t Always Mean High Engagement: Pitfalls and Fixes
Chasing impressions can mislead massive numbers often mask low-quality exposure, where frequency overwhelms without resonance. Algorithm quirks amplify this: Bought promotions or bot farms inflate impressions sans genuine engagement, eroding rates and risking shadowbans per X policies.
Case study: A viral meme hits 10 million impressions but 0.2% engagement rate. Why? Broad but shallow reach to uninterested users via paid boosts. True growth demands targeted exposure—e.g., niche hashtags yielding 500,000 impressions at 4% engagement (20,000 interactions).
Common traps:
- Audience mismatch: Impressions from global trends ignore local relevance, tanking interactions.
- Content fatigue: High frequency (10x+ per user) breeds skips.
- No hooks: Static posts lag videos in converting impressions to views/engagements.
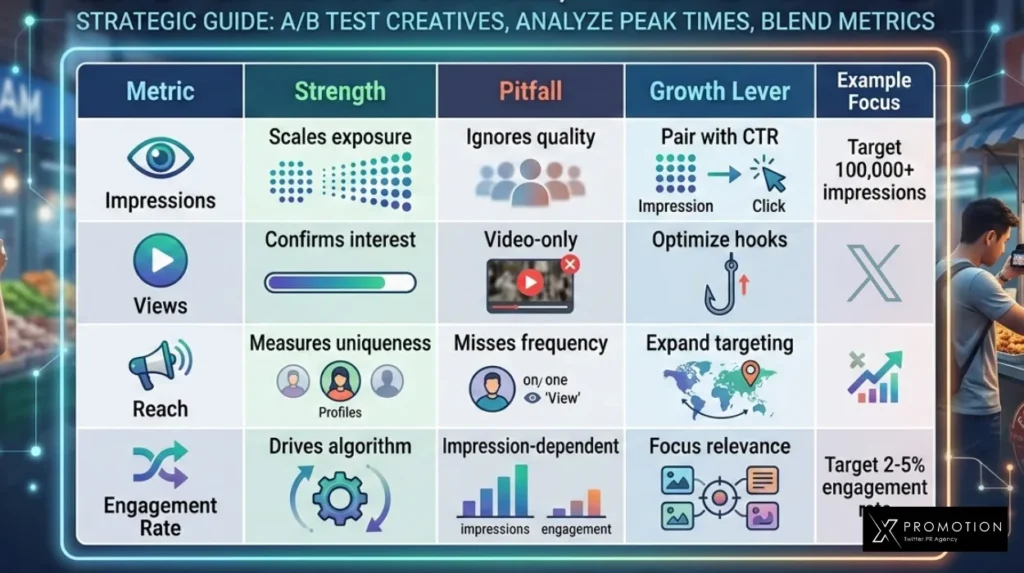
Fixes for growth: A/B test creatives, analyze peak audience times, and blend metrics target 2-5% engagement rate on 100,000+ impressions. In East Ham’s market, a food brand shifted from 1M low-engagement impressions to 300K high-impact ones, doubling followers.
Tying It All Together: Actionable Strategies for X Growth
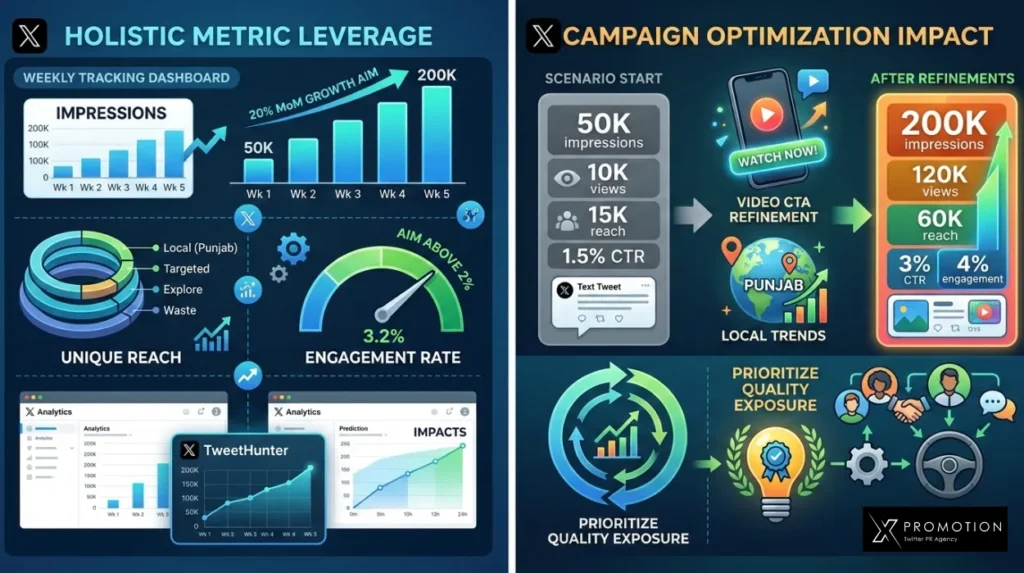
Leverage these metrics holistically. Track weekly via X Analytics: Aim for impressions growing 20% MoM, reach expanding uniquely, and engagement rates above 2%. Tools like TweetHunter complement by forecasting frequency impacts.
Scenario payoff: Your PR campaign starts with 50K impressions, 10K views, 15K reach, 1.5% CTR. Refinements video CTAs, local trends scale to 200K impressions, 120K views, 60K reach, 3% CTR, and 4% engagement, compounding growth.
Prioritize quality exposure over vanity metrics. High impressions fuel the engine, but views, reach, and engagement steer toward sustainable audience growth.
What’s the main difference between impressions and views on X (Twitter) ?
Impressions count every screen appearance of your post, capturing total potential exposure. Views, however, require at least 2 seconds of video playback, confirming actual consumption. For example, a post with 100,000 impressions might only get 30,000 views if users scroll past most videos.
Why do I have high impressions on X (Twitter) but low engagement?
High impressions often mean broad but shallow exposure, like algorithmic pushes to uninterested users. Factors include content fatigue from over-frequency or weak hooks. Aim for 2-5% engagement rates by testing CTAs and relevance to convert visibility into likes, replies, and reposts.
How is click-through rate (CTR) calculated using impressions on X (Twitter)?
CTR = (Clicks / Impressions) × 100. A post with 50,000 impressions and 1,000 link clicks has a 2% CTR. Track this performance metric in X Analytics to gauge conversion potential—industry benchmarks hover at 1-3% for organic posts.
Can views help improve my overall reach on X (Twitter)?
Yes—high views signal strong retention, boosting X’s algorithm to expand reach organically. Videos with 50%+ view-to-impression ratios often see wider distribution. Focus on engaging thumbnails to turn impressions into views and snowball audience exposure.
What’s a good engagement rate on impressions for X (Twitter) growth?
Target 2-5% (engagements like likes/reposts divided by impressions). Below 1% flags issues like irrelevance; above 5% accelerates growth via algorithmic favoritism. Real-world tip: Niche topics in local markets (e.g., Punjab events) often hit higher rates.
How can I use these metrics to grow my X (Twitter) account?
Scale impressions with consistent posting, optimize views via video, expand reach with trends, and monitor CTR/engagement for quality. Review X Analytics weekly e.g., if impressions rise but reach stalls, diversify hashtags for fresh audience exposure.